VESPUCCI
About VESPUCCI :
Vespucci is a new system, developed by Pythagoras Systems, that monitors the evolution of blockchain and cryptocurrency markets and, by harnessing the power of cutting-edge AI and Machine Learning technology, delivers unbiased, robust and up-to-date rankings that represent the real value of a very wide spectrum of coins as well as their potential. In short, the platform provides non-experts with the following services:
An intuitive analytical agent and overview of cryptocurrencies,
A rating system of cryptocurrencies, with risk assessment,
A dashboard for cryptocurrency news.
Vespucci is a major pillar of the Volentix ecosystem and shares its values: decentralized governance, peer privacy, public ledger via a public blockchain, open-source software and ease of use. Vespucci is a system that evaluates cryptocurrencies using a large set of sources, categorized in three pillars:
a sentiment gauge for sentiment analysis (SA),
technical / economics analysis (TA),
and fundamental / technological analysis (FTA).
VESPUCCI OVERVIEW:
Vespucci is developed by Pythagoras Systems as part of the Volentix ecosystem. In particular, it implements one of the main pillars of the Volentix ecosystem, of which VDex is the fulcrum.
VDex is a decentralized exchange with the user and community in mind [10]. Vespucci, besides being a digital asset audit and assessment utility accessible to non-experts, it is also a tool to chart and juxtapose tradeable digital assets. Moreover, it provides a dashboard for cryptocurrencies’ activity in the digital world.
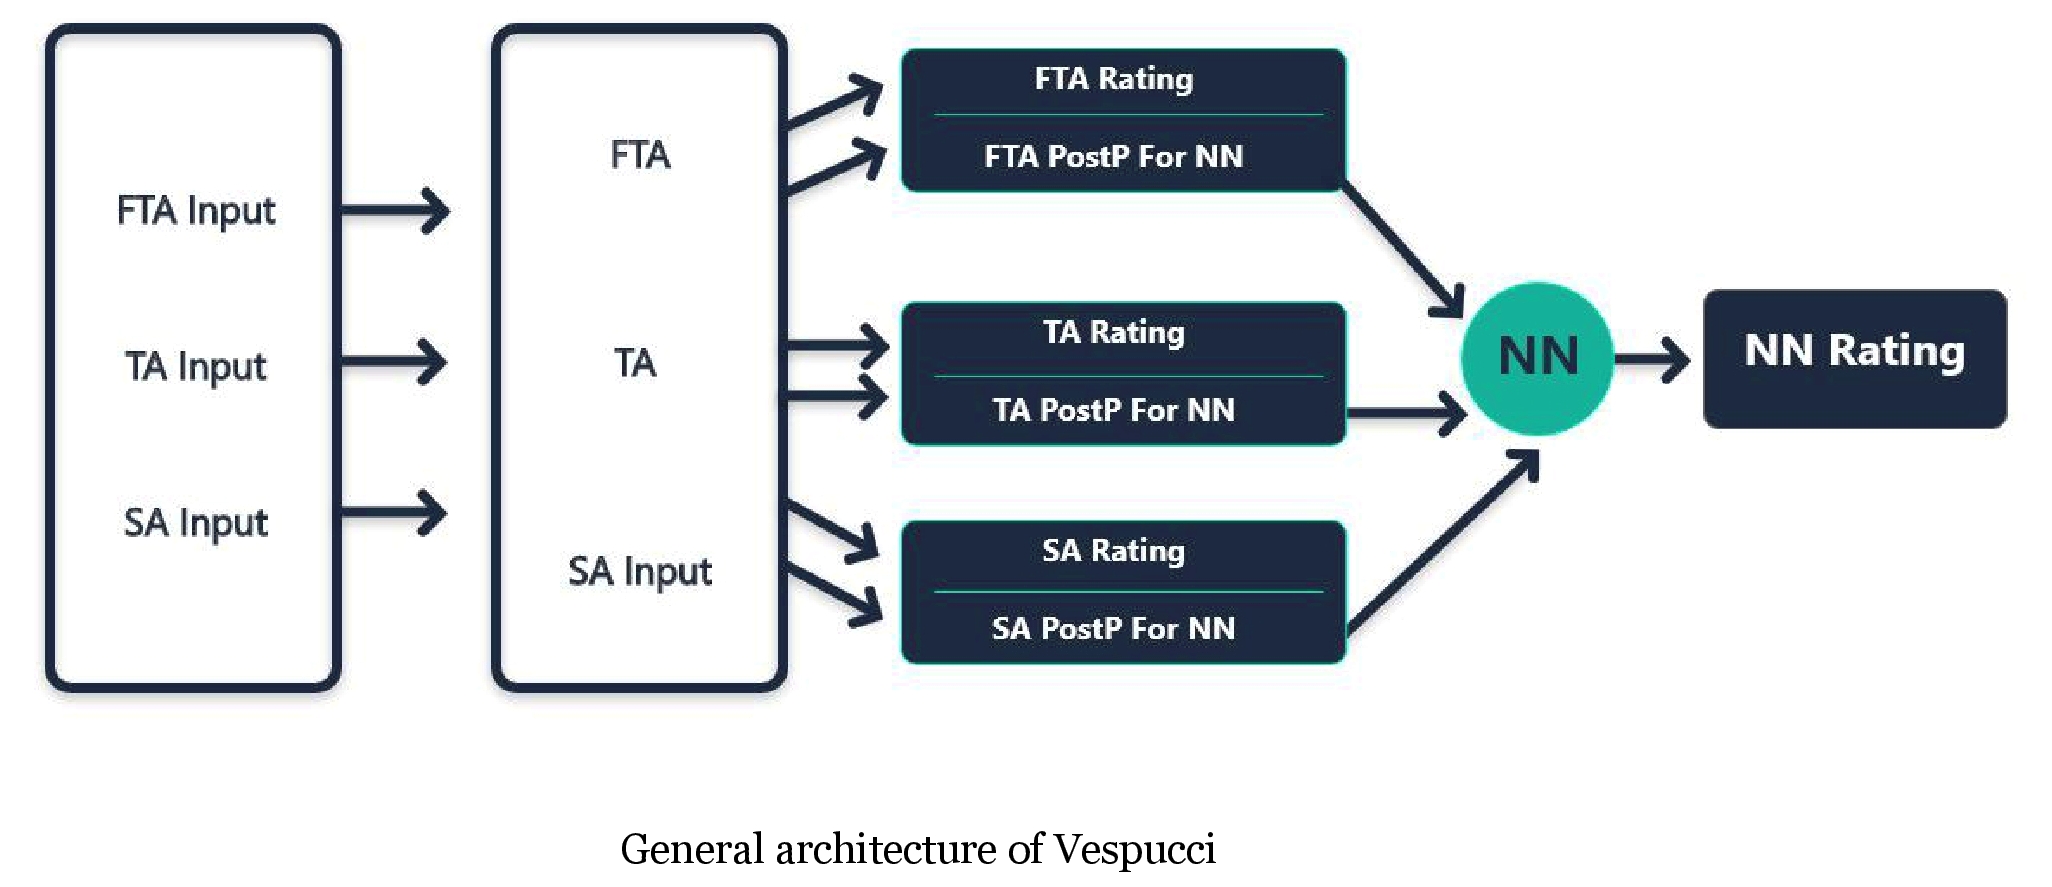
Vespucci offers all users of digital assets an intuitive analytical agent and rating system for such assets, merging the following aspects (see figure below on “General architecture”):
● a sentiment gauge for Sentiment Analysis (SA),
● Technical Analysis (TA), and
● Fundamental / Technological analysis (FTA).
Vespucci ( www.vespucci.site ) offers for the first time a well-rounded profile of each digital asset of interest along with a live rating, representing a combination of different indicators, based on the principles of decentralized governance, peer privacy, public ledger via a public blockchain, and open source code. Hence, its analysis is free of the bias of specific individuals or interest groups and the employed methods are up for scrutiny and discussion by the community.
Decentralized applications constitute a major paradigm shift in current technology; a particularly relevant instance lies within the emerging cryptocurrency exchanges. While leveraging some of the most powerful cutting-edge algorithmic technologies, our approach abides by open standards and the principles of ease of use.
Volentix Introduces Vespucci for Comprehensive Cryptocurrency Market Analysis:
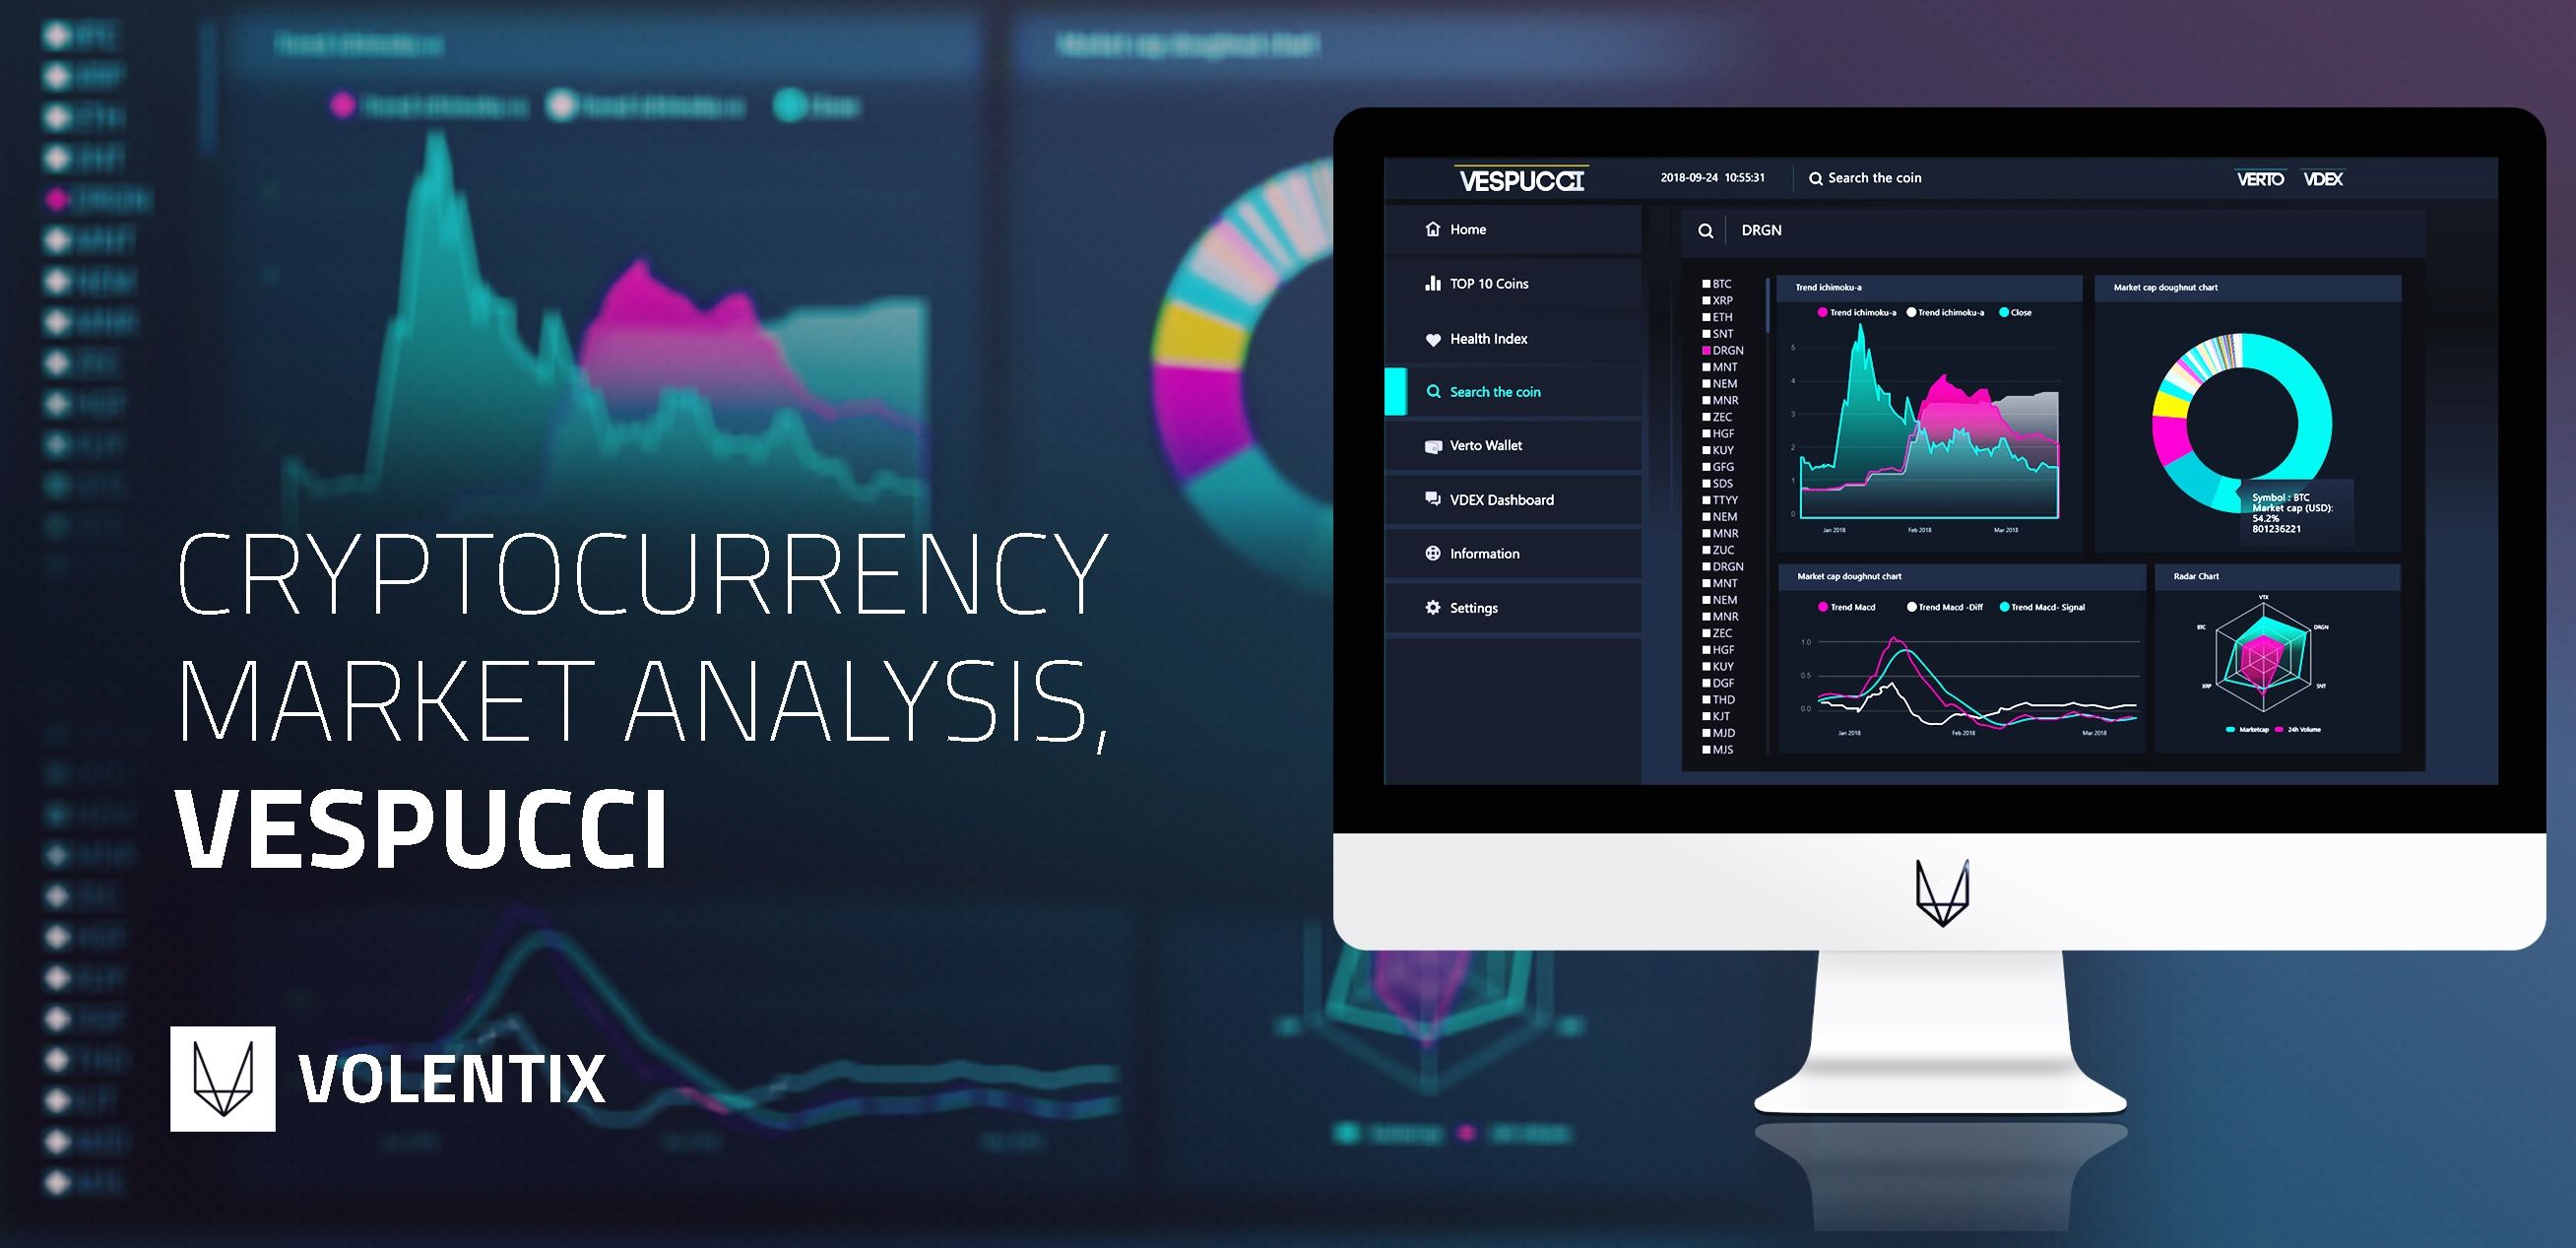
Volentix is pleased to announce the initial design for its analytical engine VESPUCCI is complete. Vespucci is designed to respond to the demand for useable metrics relating to cryptocurrency trading. Vespucci will provide historical and real-time market data to produce rankings and trends, as well as software development assessments and sentiment analyses.
Vespucci is one of the four core constituents of the Volentix digital assets ecosystem. Vespucci integrates with the multi-currency peer-to-peer wallet VERTO, the incentives-based recruitment platform VENUE, and the planned decentralized exchange VDEX.
Vespucci introduces three categories of analysis:
(1) sentiment analysis (SA);
(2) fundamental and technological analysis (FTA);
(3) technical analysis (TA). Vespucci utilizes transparent methodology and comprehensive data collection techniques to prevent bias. Vespucci’s open-source software provides customized solutions employing existing technology compatible with and inspired by both EOS and Ethereum.
Vespucci Crypto Rating:
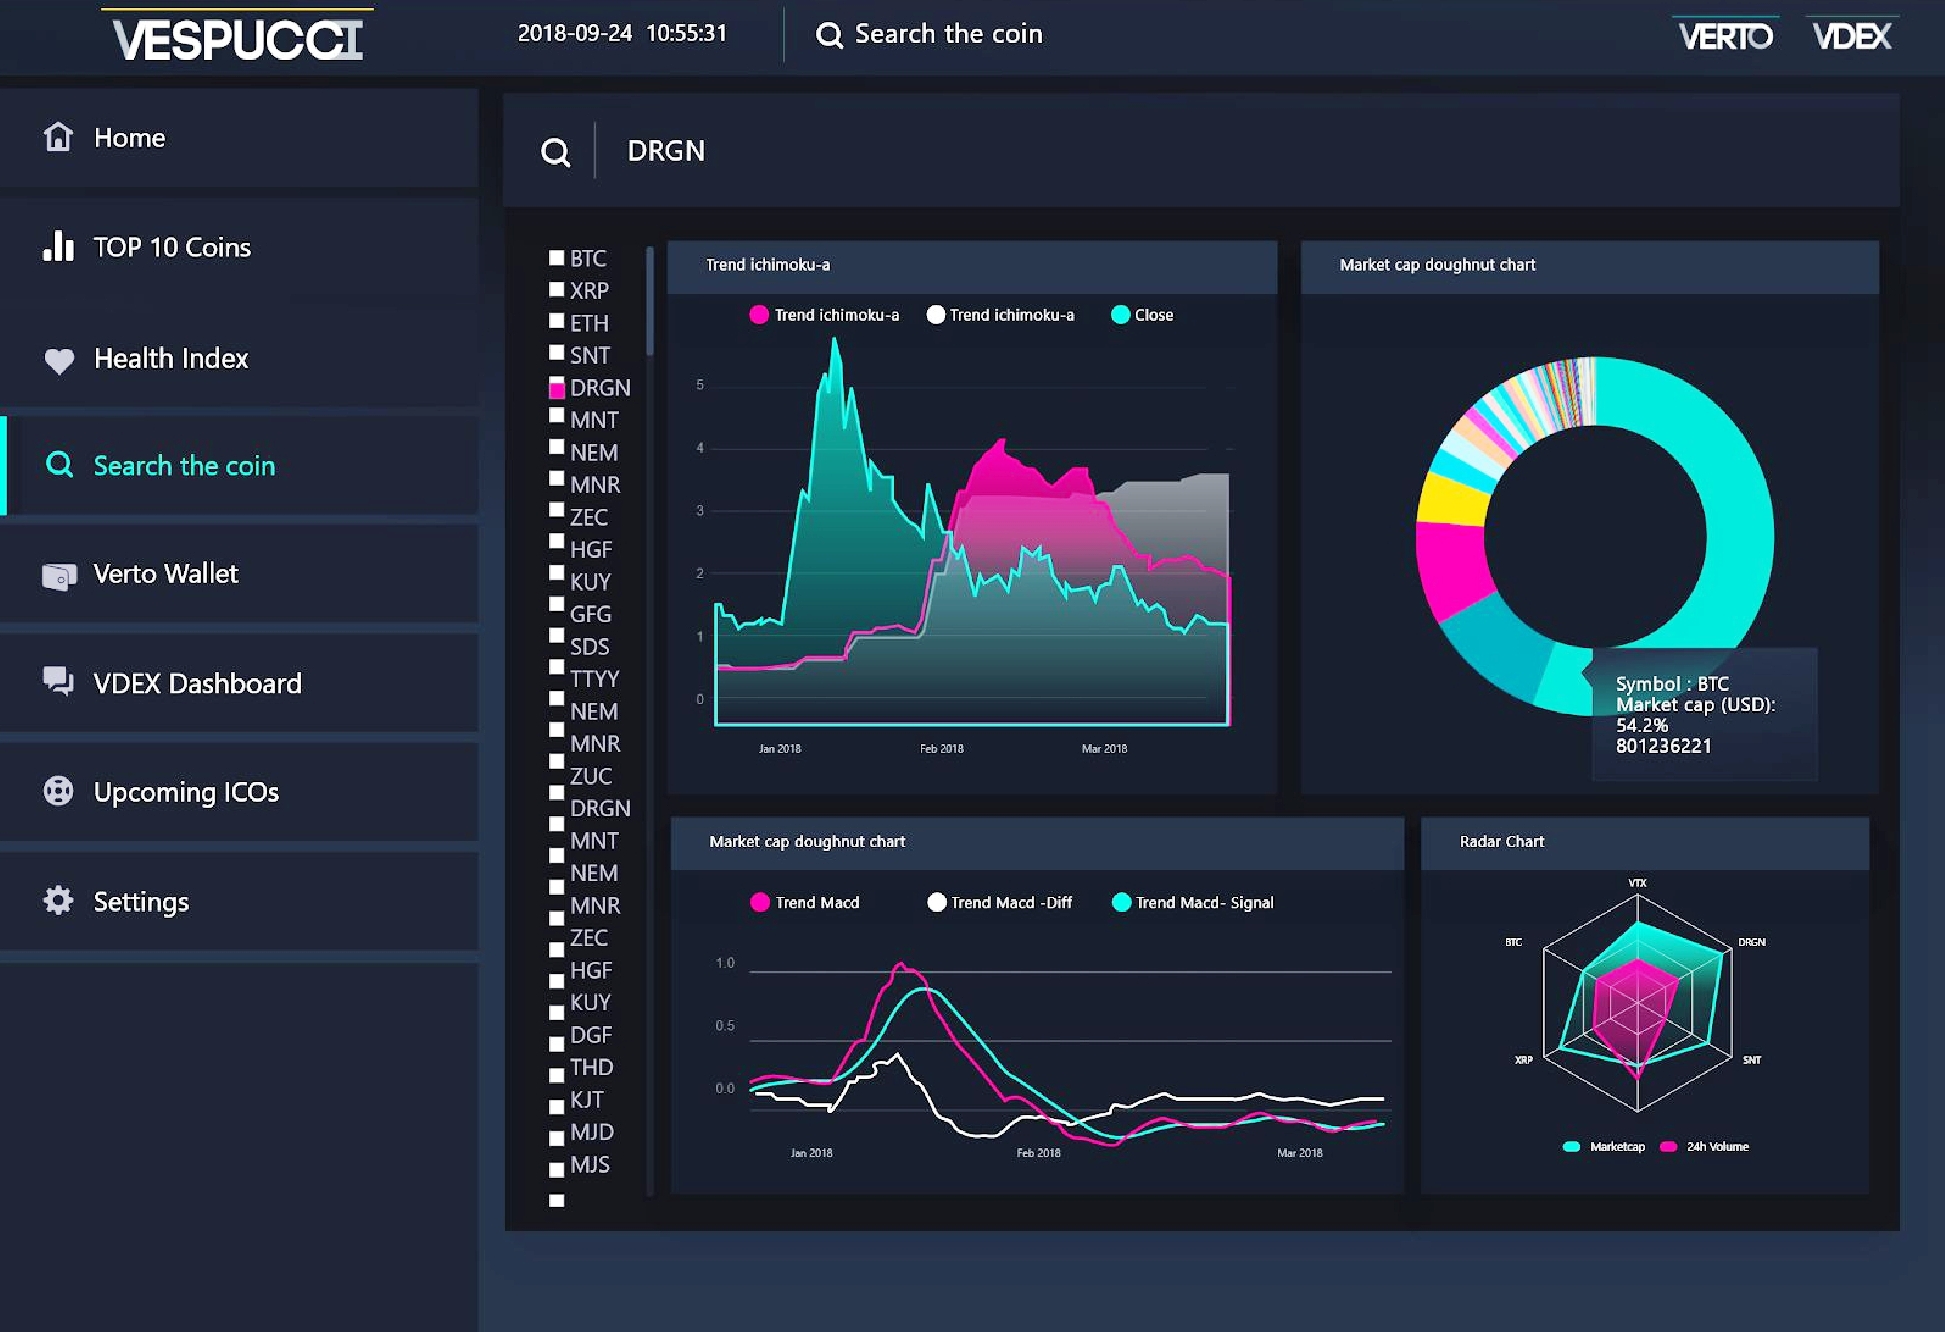
VESPUCCI is in development as an analytics engine accessible via a user-friendly interface with treasure troves of real-time and historical market data, including digital assets ratings and sentiment analysis.
A new system, developed by Pythagoras Systems, that monitors the evolution of blockchain and cryptocurrency markets and, by harnessing the power of cutting-edge AI and Machine Learning technology, delivers unbiased, robust and up-to-date rankings that represent the real value of a very wide spectrum of coins as well as their potential. In short, the platform provides non-experts with the following services:
• An intuitive analytical agent and overview of cryptocurrencies,
• A rating system of cryptocurrencies, with risk assessment,
• A dashboard for cryptocurrency news.
Vespucci is a major pillar of the Volentix ecosystem and shares its values: decentralized governance, peer privacy, public ledger via a public blockchain, open-source software and ease of use. Vespucci is a system that evaluates cryptocurrencies using a large set of sources, categorized in three pillars:
• a sentiment gauge for sentiment analysis (SA),
• technical / economics analysis (TA),
• and fundamental/technological analysis (FTA).
THE PILARS :
1- SENTIMENT ANALYSIS:
Market sentiment is being explored by the relatively new field of behavioral finance. It starts with the assumption that markets are apparently inefficient much of the time, and this inefficiency can be explained by psychology and other social sciences. The idea of applying social science to finance was fully legitimized when D. Kahneman, a psychologist, won the 2002 Nobel Memorial Prize in Economics – he was the first psychologist to do so. Many of the ideas in behavioral finance confirm observable suspicions: that investors tend to overemphasize data that come easily to mind; that many investors react with greater pain to losses than with pleasure to equivalent gains; and that investors tend to persist in a mistake.
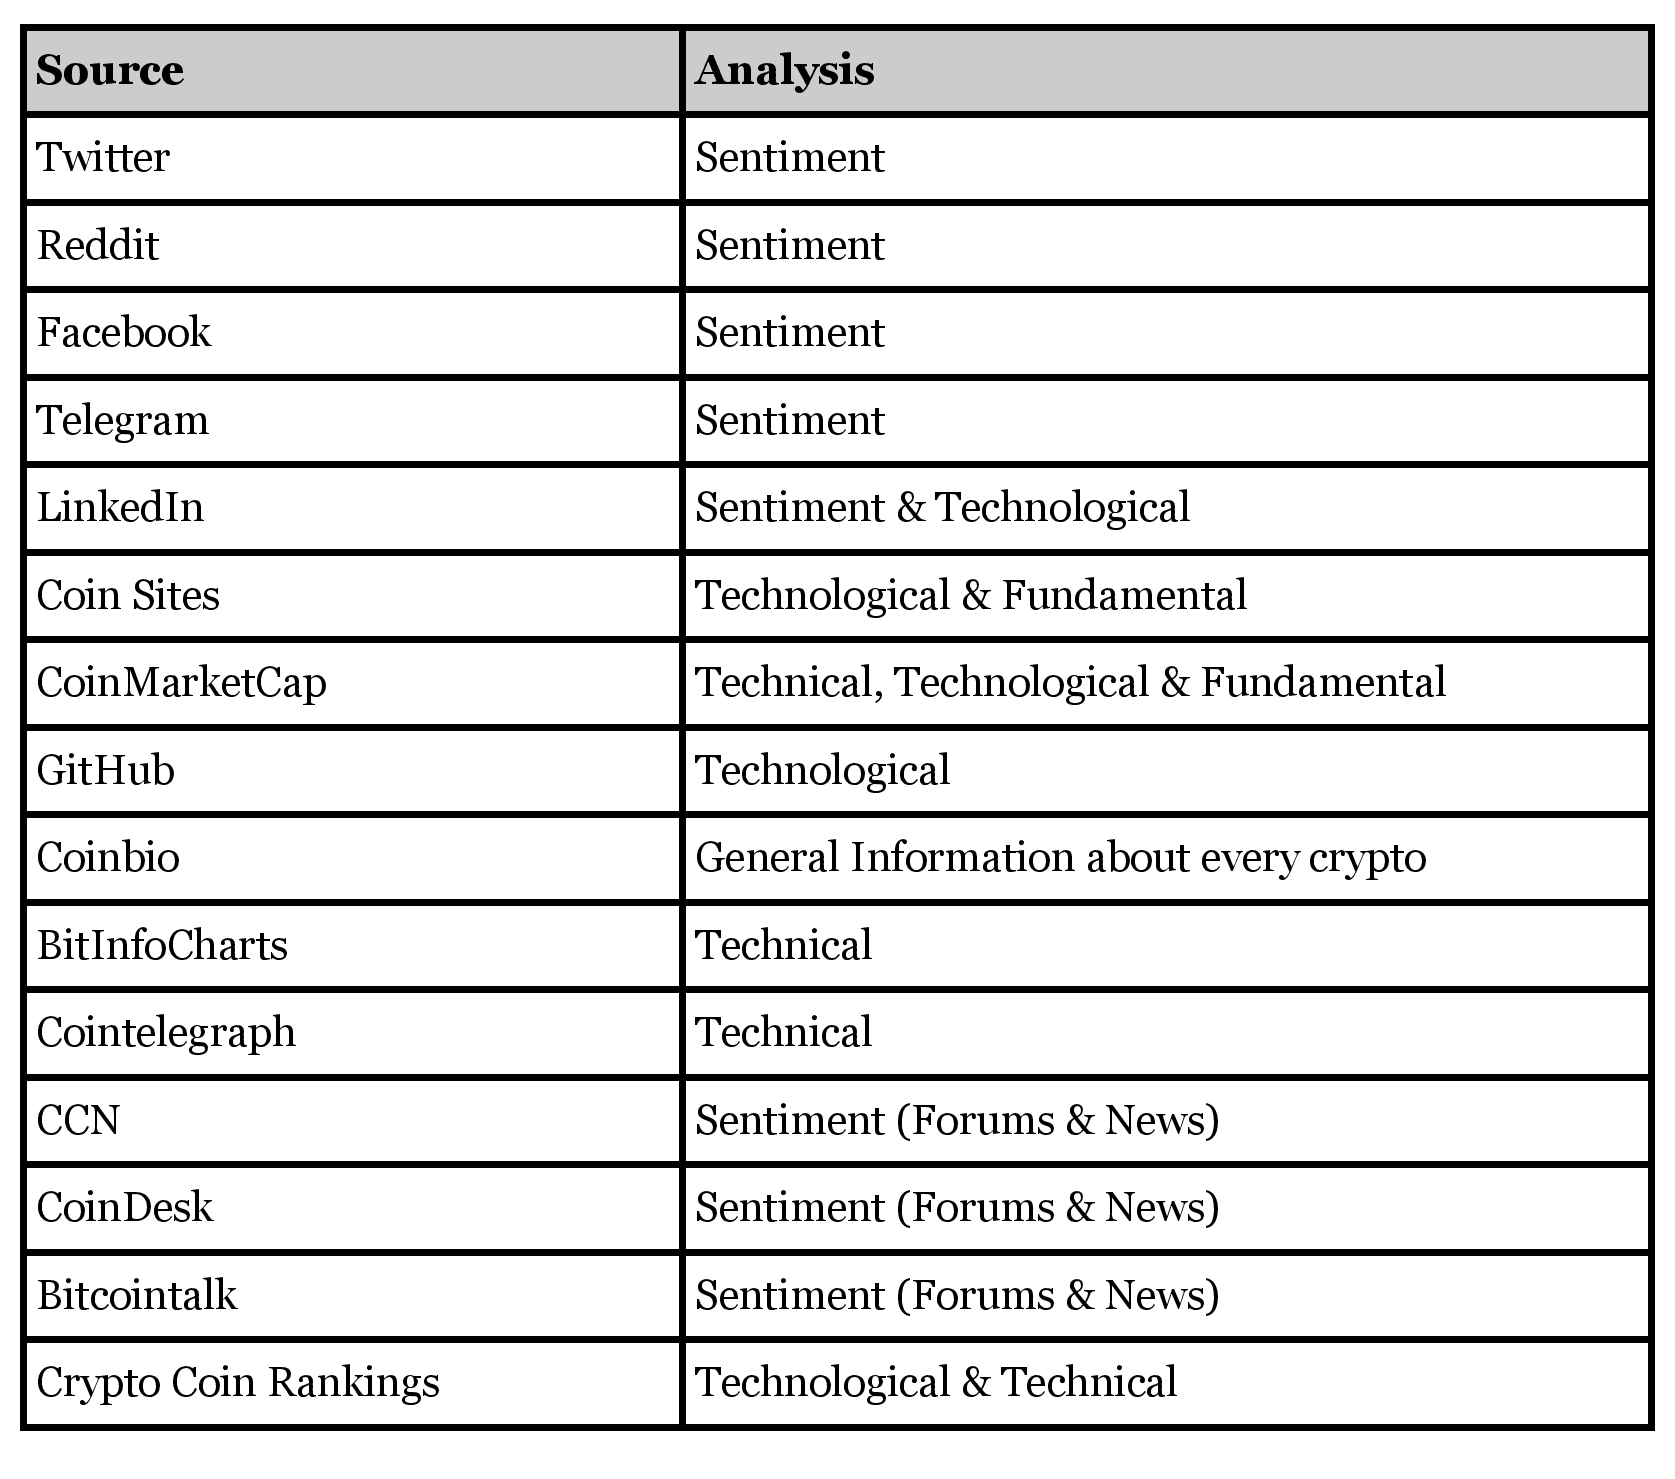
One of the most significant factors that affect the rank and value of crypto-coins is the public confidence and sentiment. Sentiment bears major weight of cryptocurrencies monetary valuation. Public opinions are widely available to collect and analyze. A major pillar of the Vespucci ranking platform is hence based on Sentiment Analysis (SA) of crypto related content, generated by the public on Social media (Twitter, Facebook, Telegram), Reddit, Blogs, forums and news sites. The key differentiating fact of Vespucci SA component is the broad and complete spectrum of data sources that are collected and analyzed. We believe that only by covering every potential source of public opinion related to each crypto-coin, the true state of market sentiment is revealed.
Vespucci SA component is built in a phased approach. The first phase includes the implementation of a centralized cloud based, highly scalable, Big Data ingestion mechanism. This mechanism is able to listen continuously to the above mentioned data sources and ingest all content/messages that are relevant to each cryptocurrency. It uses no persistent storage. The same mechanism scores the Sentiment of the ingested content using an AI driven score function and text analytics libraries for analyzing social media content. The module also relies on further tools such as NTLK and TextBlob that assign numerical scores of sentiment to pieces of text. This process need not be transparent to the user.
This ensures that Vespucci SA component is able to cover the vast majority of public opinion. Results are compared over periods of one hour, one day and one week. The outputs are available through APIs for internal use by other Vespucci components such as the front-end web UI as well as to external users that want to consume the data or build third-party applications based on Vespucci.
Vespucci’s public opinion listeners run on cloud-based VMs that are able to instantly scale-out to address all potential workloads. This way Vespucci handles and ingests the massive, yet valuable, data volumes related to cryptocurrencies that are being generated at every given moment. Parallelization is key when handling Big Data and Vespucci’s architecture leverages parallelization, multi-threading and concurrency wherever possible. Micro-services and serverless code run in parallel to orchestrate the ingestion procedures and data flows.
In the second phase, scoring tools are adapted and enhanced so as to focus their functionality to cryptocurrencies and, eventually, our own software shall be developed for this task. Moreover, some storage is used (see the relevant section) for aggregate data needed in order (a) to make historical comparisons and (b) to train the Convolutional Neural Network that produces the final score. For (a), we could make use of the entire history of each token since its creation. For (b), deep learning needs data covering a period of up to two years.
Eventually, Vespucci will reach out to the open-source community in an attempt to make the platform decentralized to a great degree. The intention is to decentralize the data ingestion and sentiment scoring functionality in order to provide secure, community led, unbiased and credible results.
By leveraging Python’s Machine learning framework, and given the language’s advantages, it is only natural for this module to be implemented in Python. It interfaces with particular machine learning libraries such as Scikit-learn, TensorFlow, CNTK, Torch, Theano, and Keras.
A user experience linking to the cryptocurrency’s public community forum is developed to provide up to date announcements and statistics of community activity. The final score can be derived as a scoring function. Eventually, machine learning techniques are applied to deliver real-time sentiment analysis.
2- TECHNICAL ANALYSIS
Technical analysis is a trading tool employed to evaluate securities and identify trading opportunities by analyzing statistics gathered from trading activity, such as price movement and volume. Unlike fundamental analysts who attempt to evaluate a security’s intrinsic value, technical analysts focus on charts of price movement and various analytical tools to evaluate a security’s strength or weakness. A typical source may be coinmarketcap. We focus on indicators and methods suitable for assets with high volatility of prices, and hence suitable for cryptocurrencies.
Technical analysts believe the analysis of price movement or the supply and demand of currencies is the best way to identify trends in the currency. Price movements tend to trade within a trend or range. In connection with this belief, technical analysts assume that history tends to repeat itself, based on the idea that market participants have often reacted in a similar fashion to reoccurring market events. There is a very large number of techniques and indices for data analysis. In this section, we focus on certain simple techniques, such as Keltner Channels, moving average crossovers, RSI, Bollinger Bands, and the popular MACD, and to some advanced methods, such as Fibonnaci, and Ichimoku Kinko Hyo.
Keltner Channels put an upper, middle and lower band around the price action on a stock chart. The indicator is most useful in strongly trending markets when the price is making higher highs and higher lows for an uptrend, or lower highs and lower lows for a downtrend.
Moving average crossovers: The reason moving average is so important for traders and analysts is its smoothing role. It is responsible for noise removal, for outlier detection and emphasizes in long term trends. Several different kinds of moving average calculations exist, but all of them are used to plot a line against either a price chart or another indicator. The direction and slope of moving average lines inform investors about the relationship between historical data values and present data values. The flexibility of moving averages allows them to be used to analyze other moving averages. A common strategy involves plotting two moving average lines of different time intervals and interpreting their relationship to spot trends, forecast price movements and place trades. Moving average crossovers have subsequently become the focus of an entire subset of technical indicators. When utilizing moving averages, crossovers can determine a change in the price trend. A common trend reversal technique is utilizing a five-period simple moving average with a 15-period simple moving average. When the five-period moving average forms a crossover, it signals a reversal in the trend and potentially the start of a new opposite trend, which is called a breakout or a breakdown.
Relative Strength Index (RSI) is a momentum indicator that measures the magnitude of recent price changes to analyze overbought or oversold conditions. It is primarily used to attempt to identify overbought or oversold conditions in the trading of an asset. The RSI provides a relative evaluation of the strength of a security’s recent price performance, thus making it a momentum indicator. RSI values above or equal to 70 indicate that a security is becoming overbought or overvalued. RSI reading below or equal to 30 is commonly interpreted as indicating an oversold or undervalued condition that may signal a trend change or corrective price reversal to the upside. Some traders, in an attempt to avoid false signals from the RSI, use more extreme RSI values as buy or sell signals, such as RSI readings above 80 to indicate overbought conditions and RSI readings below 20 to indicate oversold conditions. Sudden large price movements can create false buy or sell signals in the RSI. It is, therefore, best used with refinements to its application or in conjunction with other, confirming technical indicators.
Bollinger Bands are a technical chart indicator popular among traders across several financial markets. On a chart there are two “bands” that sandwich the market price. Many use them primarily to determine overbought and oversold levels. A common strategy is to sell when the price touches the upper Bollinger Band and buy when it hits the lower band. This technique also called range-bound markets. In this type of market, the price bounces off the Bollinger Bands like a ball bouncing between two walls.
MACD calculates the difference between a currency’s 26-day and 12-day exponential moving averages (EMA). The 12-day EMA is the faster one, while the 26-day is a slower moving average. The calculation of both EMAs uses the closing prices of whatever period is measured. On the MACD chart, a nine-day EMA of MACD itself is plotted as well, and it acts as a signal for buy and sell decisions.The MACD histogram provides a visual depiction of the difference between MACD and its nine-day EMA. MACD histogram is one of the main tools traders use to gauge momentum, because it gives an intuitive visual representation of the speed of price movement. For this reason, the MACD is commonly used to measure the strength of a price move rather than the direction or trend of a currency.
More advanced techniques for data analysis are the Fibonacci methods as well as Ichimoku Kinko Hyo techniques, as discussed in the sequel.
Fibonacci Extension: _They are popular forecasting tools, often used in combination with other technical chart patterns. Many traders use this technique in conjunction with wave-based studies (Elliott Wave, Wolfe Wave) to estimate the height of each wave and define the different waves. They commonly used with other chart patterns such as the ascending triangle. Once the pattern is identified, a forecast can be created by adding 61.8% of the distance between the upper resistance and the base of the triangle to the entry price.
Fibonacci Clusters: _The Fibonacci cluster is a culmination of Fibonacci retracements from various significant highs and lows during a given time period. Each of these Fibonacci levels is then plotted on the “Y” axis (price). Each overlapping retracement level makes a darker shade on the cluster – the darker the cluster is, the more significant the support or resistance level tends to be. This technique can be used in conjunction with other Fibonacci techniques or chart patterns to confirm support and resistance levels.
Fibonacci Channels: _The Fibonacci pattern can be applied to channels not only vertically, but also diagonally. One common technique is the combination of diagonal and vertical Fibonacci studies to find areas where both indicate significant resistance.
Ichimoku Kinko Hyo: _is a technical indicator that is used to gauge momentum along with future areas of support and resistance.It was originally developed by a Japanese newspaper writer to combine various technical strategies into a single indicator that could be easily implemented and interpreted. Ichimoku indicator is a combination of five key components:
1. Tenkan-sen: _Represents support and resistance level, and it’s a signal line for reversals.
2. Kijun-sen: _Represents support and resistance level. It’s a confirmation of a trend change, and can be used as a trailing stop-loss point.
3. Senkou Span A: _Is the average of tenkan-sen and kijun-sen for 26 periods ahead. The resulting line is used to identify future areas of support and resistance.
4. Senkou Span B: _Is calculated by the highest high and the lowest low over the past 52 periods, for 26 periods ahead. The resulting line is used to identify future areas of support and resistance.
5. Chickou Span: Is the current period’s closing price plotted 26 days back on the chart. This line is used to show possible areas of support and resistance.
3- FUNDAMENTAL AND TECHNOLOGICAL ANALYSIS
Various blockchain technologies have been developed to tackle various challenges and, therefore, are meant to satisfy different requirements. A review of the technical concepts of the different blockchain technologies is our basis in understanding the impact of the different architectures in terms of performance, privacy, security and regulation. Quantitative analysis from a technological perspective (not to be confused with technical analysis) appraises and correlates various network statistics gleamed from the blockchain, giving a real-time view of the cryptocurrency. These statistics include but are not limited to:
• Block propagation time is important, since newly-found blocks need to be propagated as
soon as possible across the blockchain network. Except for the waiting time for the user,
another major issue coming from propagation time is that even for tiny delays, another
block found at the same time might win the “block race”.
• Hash rate vs Difficulty over Time, Price and Power consumption. These indicators, could
show various correlations with Hash Rate, i.e. the hashrate could follow a corresponding
increase or decrease to the price. Networks’ Hash Rate is also a security indicator, since
networks which have low hash rate is easier to be tampered.
• Node activity and distribution. Nodes are vital parts of a blockchain, since it is maintained
by them. They are connected to the blockchain network, transmitting and receiving the
transactions, having their own copy of the blockchain. Therefore, their activity, distribution
and average size can provide useful information about the blockchain.
• Coin distribution, including information on how the coin is distributed among the
developers, the foundation/production team, and the public. Also, the rate of change of the
total supply and how is then distributed seems to provide useful statistics on the actual
value of the coin and indication of possible frauds.
• Miner distribution, indicating the number of miners online and how they are distributed (by
pool), their fees, luck etc. Also,he software version of miners is also important, since ideally
they should be on its latest version in order to support all the features of the Coin that they
are mining.
• Transaction levels, where various measures could be taken into account, such as the
number of transactions submitted or validated per second by each node and the entire
network, the average time of validation for a transaction and its volatility.
• Transactions fees, that users might pay to the network, in order to complete transactions
or smart contracts.
• Security includes several aspects such as the vulnerability of the system to attacks (e.g.
double spending, Sybil attacks), the confidentiality of transactions, as well as user
anonymity.
• Scalability concerns how the system’s performance is affected by the number of nodes,
transactions and users, and the scattering of the geographic positions of the nodes.
• Hardware requirements for storage, memory and processors needed to store the
blockchain network and validate the transactions and blocks, as well as how these
requirements change while the networks grows.
_To implement the above analysis, further detail is given in the next section. Today, blockchain explorers are widely available to support this task. In particular, blockchain explorers such as coinmetrics and cryptocompare were combined, in order to meet the needs of FTA. The former is an open source crypto-asset analytics service, providing daily data for the most major cryptocurrencies (about 64 currently). Cryptocompare is a platform with live cryptocurrency data; its API makes available historical and live streaming cryptocurrency data, such as pricing, volume and block explorer data from multiple exchanges and blockchains.
Among others, some of the features available by both APIs are:
- transaction count – number of transactions happening on the public blockchain a day
- transaction volume (usd) – total value of outputs on the blockchain, on a given day
- adjusted transaction volume (usd) – estimated (https://coinmetrics.io/introducing-adjusted-estimates)_
- payment count
- active addresses_
- fees
- median fee_
- generated coins
- average difficulty
- median transaction value (usd)
- block size
- block count
- price (usd)
- market capitalization (usd)
- exchange volume(usd)
- total coins mined
- difficulty adjustment
- block reward reduction, number & time
- net hashes per second
- total coins mined
Source Code – Developer activity:
_There is an aspect of quantitative analysis from a social perspective which looks at the involvement of the developer community surrounding the project, quite related to Sentiment Analysis. Research into metrics that accurately reflect rates of community participation as well as creator participation will be assessed. These factors may include but are not limited to:
• online community participation
• code base activity
• creator approachability and responsiveness
.
This module (related to Sentiment analysis) examines information from Github and other sources such as literature review. It grades the quality of a codebase by looking at social cues well-known among software developers, and in particular:
- The expertise and track record of the team and their continued commitment to their project (frequency of commits, frequency the community responds to bugs, contributions over time, and the amount of time that has been consistently spent building up the project),
- The activity on GitHub, which is tightly related to the previous item, and the number of followers of the project,
- The quality of code (programming languages, test coverage, ratio of bugs over lines of code,build breaks etc), robustness, and maintenance of the software,
- The corresponding white paper.
- The mathematical and cryptographical principles of the system.
More specifically, some features of the git repositories that determine the repository’s popularity and robustness are its forks and stars, the activity of the maintenance team, measured by the rate of issues closed and of pull requests, as well as the quality of the project’s source code, measured by its test coverage and other code quality metrics. These can be obtained from the CoinGecko API, a cryptocurrency ranking chart app that ranks digital currencies by developer activity, community, and liquidity.
The combination of these criteria relies essentially on an adapted and powerful scoring function which, eventually, may be replaced by a Convolutional Neural Network, also discussed in support of Sentiment Analysis (see relevant section).
4- BLOCKCHAIN STATISTICS, BLOCKCHAIN FULL NODE, AND EVM ANALYSIS:
This module is responsible for communicating with each of the nodes deployed for each blockchain being assessed. Its role is to provide a coherent standardized interface to the RESTful endpoint layer so that the nature of any blockchain can be abstracted, while knowing how to query any blockchain full node being run by the system, in order to collect information about the chain and network properties of that chain. In many instances, a tradable token is not actually running on its own dedicated chain but is sooner implemented using a system of contracts running on a smart-contract-enabling blockchain such as Ethereum. In such a case, this module communicates both with the full node for this chain, and the other modules, for example, the Ethereum static analysis module mentioned deeper in this document.
A wide range of technology would be applicable for this layer, though in keeping with restricting several different technologies necessary to understand the full system, and using widely-deployed technologies, choosing a similar technology as the RESTful endpoint layer with which this module interacts would be prudent. A node.js-based module would thus be a wise choice, though other implementation technologies are certainly possible. Also, Ruby on Rails offers an extremely agile way to create REST APIs as well.
To glean the most useful information about a blockchain, it’s usually necessary to run a full node that observes each incoming block. Doing so, it can provide real-time information on any of several important statistics, including chain height, inferring average and running average block times, block sizes, transaction counts, and any number of other properties visible to any full node. The interface for querying this full node is a decision made by the designers of the client in question, and is thus the responsibility of the blockchain statistics module to conform to this interface to normalize it into a form that can be consumed upstream by modules that are agnostic to the specific interface.
A great number of the tokens being traded today are ERC20 tokens implemented on top of the Ethereum blockchain. Further, many of the most exciting tokens are part of a larger system of smart contracts that use an ERC20 token as their native token. Providing an in-depth analysis of these, and any smart contract system riding on top of Ethereum’s EVM is very useful for the high-level goals of Vespucci. This module thus exists to consume smart contract systems associated with some ERC20 tokens to grade them, at the code-level, on overall safety, the presence of bugs, and other important factors that can be ascertained with a static analysis of the contract code in a system of smart contracts. Much of its core logic is written in Python, and bridges are developed to the blockchain statistics module.
USER EXPERIENCE:
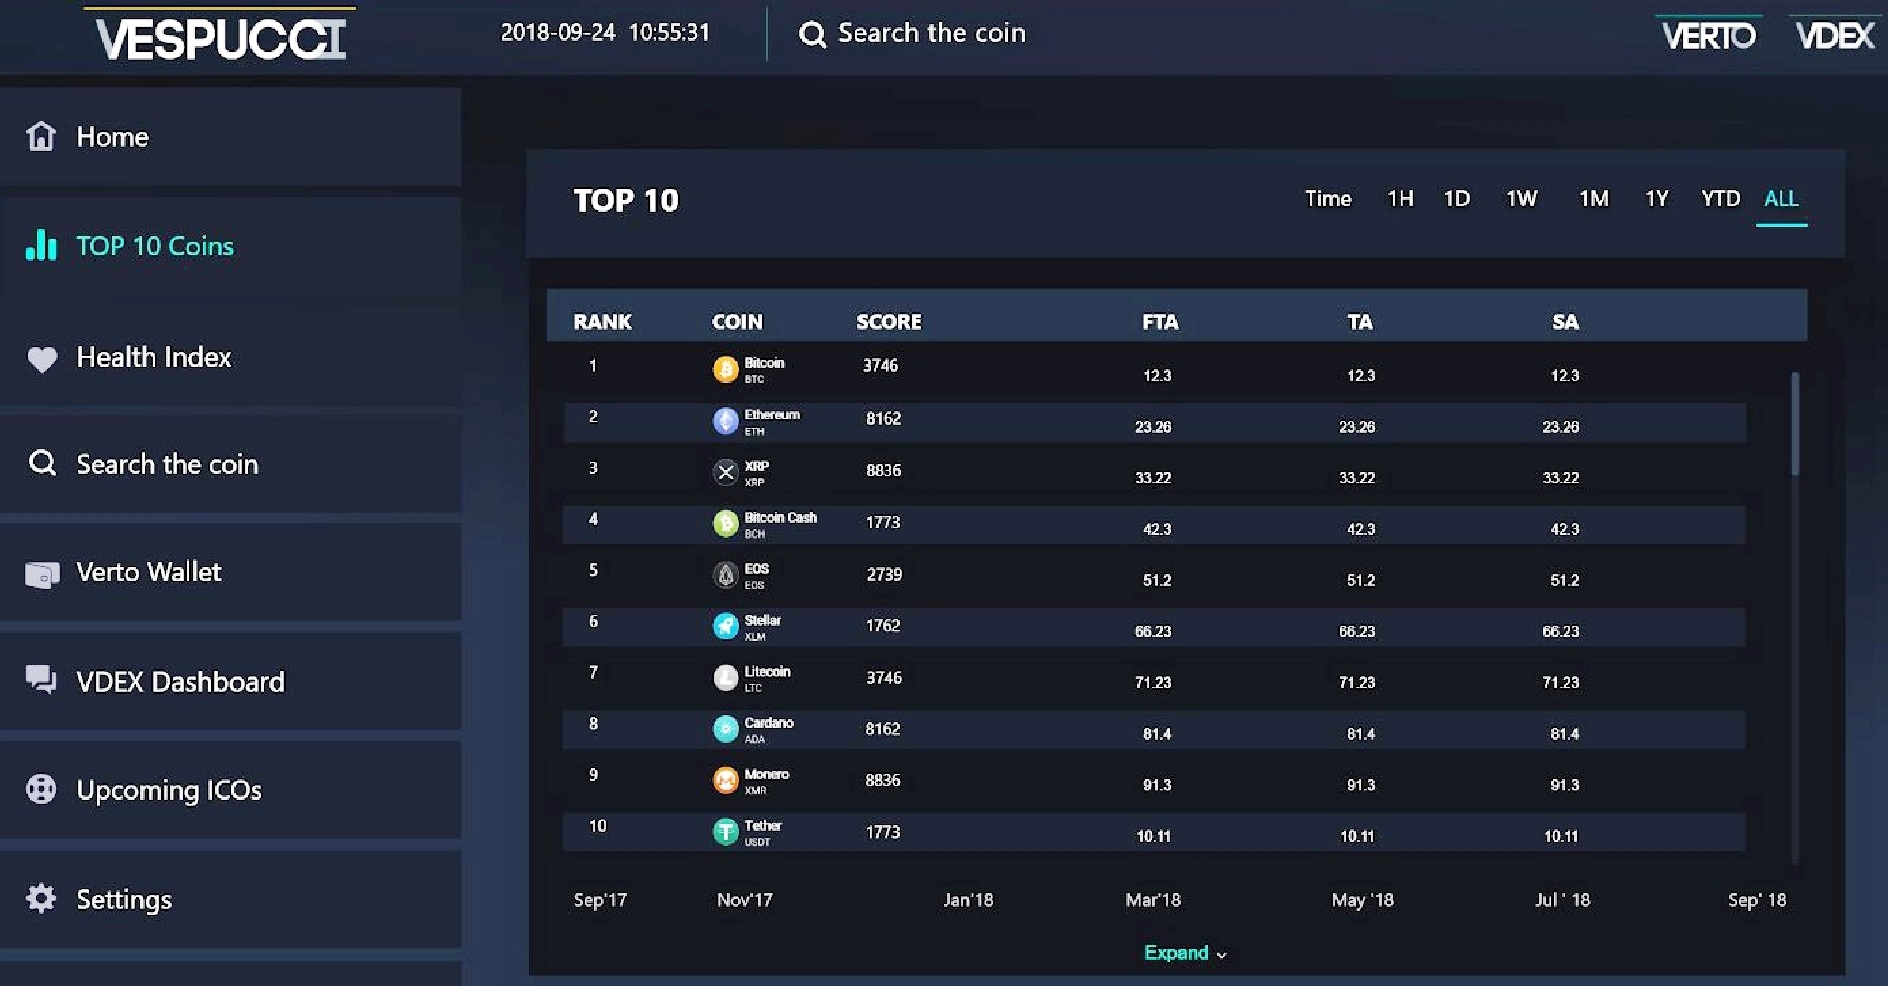
Vespucci has a User interface (UI) that allows for straightforward parameter input and coherently displays the resulting assessment metrics. The input interface provides a list with all available coins or a selection of the top ranked coins based on market cap value: the user may select those of interest to him/her. Alternatively, it is required for the user to provide the link to one (or more) cryptocurrency’s public blockchain along with the link to the project source code as basic inputs. The type and level of analysis to be performed on the given coin is chosen. More detailed analysis requires more inputs.
The results interface provides a collapsed view, providing an index for expandable sections that displays the selected metrics in detail. The collapsed view presents the colour-coded rating summary of a cryptocurrency. The colour-coded rating is calculated using a weighted average of all assessment metrics. Each expandable section displays the metric or group of metrics in a graphical manner. Assessment metrics are separated into different sections based on their represented information such as data relating to social perspective or a technical perspective. An optimal indexing of assessment metrics are determined to allow for intuitive UI interaction in accessing and view data of interest for the user.
Following the success of the Ethereum Wallet and Ethereum Mist browser, the main interface exposed to a user is hosted inside an Electron app. Electron is a mature technology introduced by Github to create modern desktop applications. Since Vespucci is not tied to Desktop-based APIs however, it is also possible to port this application to run inside of a browser. The interface for the app can be designed by using mature UI libraries for modern applications. With each component existing on its own, it is also straightforward to pull components out and add new ones as the product is trialed with users without adversely affecting the product as a whole.
PLATFORM FEATURES:
- Show all parameters that were used to calculate Vespucci score.
- Ability for the user to modify basic parameters for score configuration.
- Display filters for cryptocoins.
- Cryptocurrency index
- Rating system of Vespucci using 5 stars rating system
- Show general information and characteristics of the cryptocurrency of user’s choice
- Sentiment analysis charts
- Cryptocurrency distribution scheme
- Transaction history
- Technical Characteristics
- Charts of activity on Github
- Activity on social networks using points on world map
- Ability to add other utility charts through a list of parameters
USER OPTIONS:
- Show all the encryption, next to the name and symbol of Vespucci’s rating.
- Adjust rating system by selecting active Vespucci parameters.
- Configure rating system by selecting the priority of the basic parameters and adjusting weights.
- Be informed separately about the effect of the basic parameters via diagrams and gain a deeper picture of those that shape the fluctuation of the value of each currency.
- Filter the list of cryptocurrencies according to the hash rate and the chronological period they were active on the market.
- View cryptocurrency features in detail.
TIMELINE:
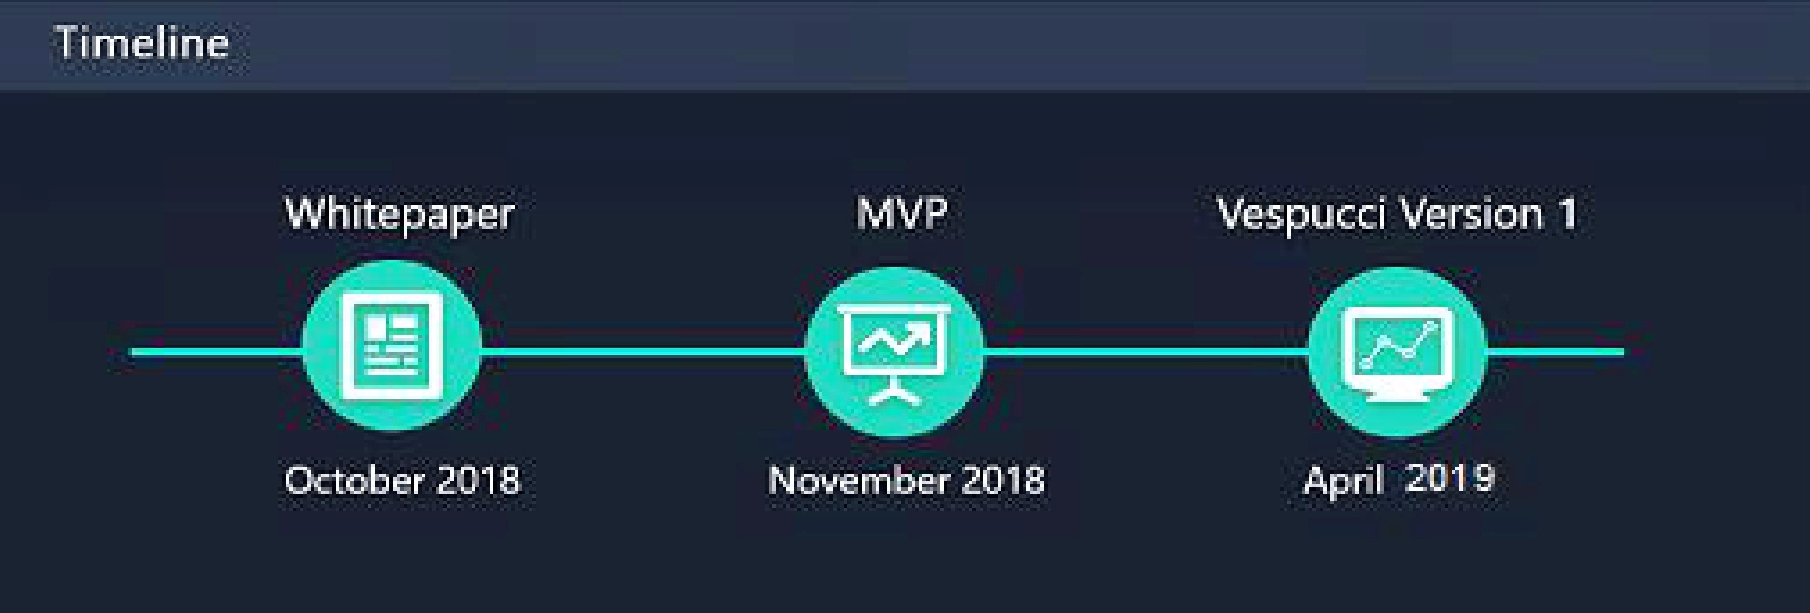
The project’s timeline is shown in the above figure. The main milestones are:
-- Vespucci Green and White Papers, October 2018
-- Vespucci MVP. November 2018 .
-- Vespucci, version 1.0. April 2019.
To contact visit our website: https://vespucci.site / https://volentix.io
Green paper : https://vespucci.site/green-paper
Whitepaper : https://vespucci.site/etc/Vespucci-whitepaper.pdf
ANN: https://bitcointalk.org/index.php?topic=5022472.msg45307298#msg45307298
I invite you to join this Dedicated # Community HERE, as well as to follow they work on:
✅ Telegram Community: https://t.me/volentix
✅ Twitter: https://twitter.com/Volentix
✅ Facebook : https:// www.facebook.com/volentix
✅ Medium: https://medium.com/pythagoras-systems-news-updates
✅ Github: https://github.com/Volentix
wallet : EOS68oqRtGfxQN6Snv1wifnMZGWCeQnBoG94nG57dJPBLr7m1VLs5
Bounty Suite Username : SADOZA
Disclaimer: This article was created in exchange for a potential token reward through Bountysuite bounty portal